How much do you know about risk? Do you understand the risk level in your fund portfolio? Our portfolio manager and partner, Marcus Grimfors, share more insights in this article.
What Does Risk Mean?
We define risk for our two portfolios using standard deviation. This value reflects how much the fund returns have fluctuated over the past five years. The time frame can vary, but five years is our standard. The higher the standard deviation, the higher the risk, and vice versa. Save Earth Fund currently has a lower standard deviation compared to both global and Swedish stocks.
Standard Deviation 5 years as of March 31, 2023 (SEK):
- Save Earth Fund: 15.1%
- MSCI World Net: 16.3%
- MSCI Sweden Net: 20.4%
An Environmental Fund with Lower Risk Than Global and Environmental Stocks
Our goal for Save Earth Fund is to provide fund owners with a portfolio carrying lower risk than both global stocks and environmental stocks.
As depicted in the image below, the risk in the water, environmental technology, and renewable energy sectors is higher than global stocks (MSCI World Net). However, the fund’s risk is still lower than global stocks. How is this possible? What strategy do we employ to achieve this?
Return and Risk, 5 years (SEK) as of March 31, 2023:

Water: iShares Global Water Index ETF; Environmental Technology: Cleantech Index TR; Renewable Energy: Invesco Global Clean Energy ETF
The water sector is the most mature/stable of the three. As the foundation of the portfolio is water, followed by environmental technology, renewable energy serves as a complement. The fund has only a small portion in the most volatile renewable energy sector but is still exposed to the sector through other more mature companies. Environmental technology is also a significant part of the portfolio, sometimes larger than water.
Sectors rarely perform well or poorly simultaneously. When one sector performs poorly, another can often compensate. See the image below for further clarification.
Diversification certainly helps; we currently have around 40 holdings in the fund. We have selected stocks and companies that weather downturns better than some others in these sectors.
We also protect the fund from downturns by, among other strategies, increasing the cash position during certain periods, which is a relatively unique approach compared to other funds. We boost cash holdings during significant downturns (cash can constitute up to 20% of managed capital), allowing us to place it in the bank and earn a risk-free interest rate for a certain period when the stock market is declining.

Risk vs. Return
The Sharpe ratio is a measure used to assess how risky a portfolio is relative to its return. It’s an excellent measure for comparing funds because it takes into account both the fund’s fee, return, and risk.
The Sharpe ratio is calculated as follows: annual fund return / standard deviation.
For long-term savings, the Sharpe ratio should be above 0.5. Over five years, Save Earth Fund has outperformed both global and Swedish stocks (as of March 31, 2023).
Save Earth Fund’s risk-adjusted return (Sharpe) for the period is 0.87, which is higher than all three environmental sectors we invest in, as well as compared to global and Swedish stocks. The Sharpe ratio is also relatively high compared to several competitors and funds in the environmental sector.

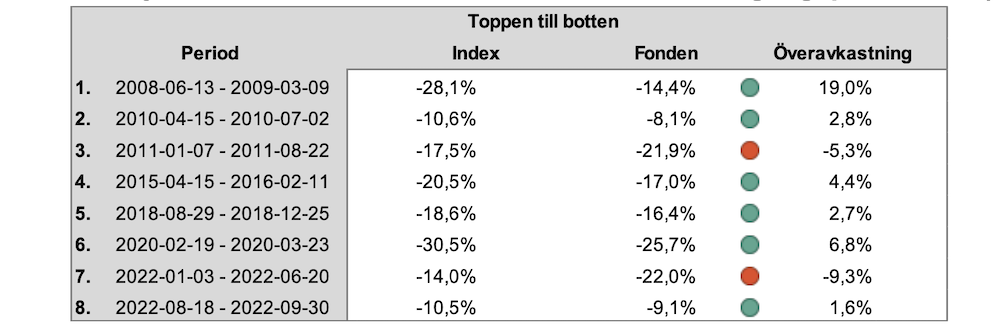
Fund Resilience During Market Downturns
Save Earth Fund’s objective is to fare better than the global stock market during declines. In approximately 75% of cases, the fund has performed better than global stocks (MSCI World Net) during downturns, as shown in the image below. Save Earth Fund has beaten the index in all downturns larger than 20%.
Fund vs. MSCI World Net During Major Downturns (SEK):
Read more in our Q1 report
Unit prices may increase or decrease in value, and investments always carry a risk of loss. Historical returns and risk levels are never a guarantee of future returns and risk levels. The information in this article is what we, with our knowledge, believe to be correct based on the information available to us for the preparation of this article. No representation or warranty of any kind, express or implied, is made about its completeness, accuracy, reliability, or suitability.
Nothing in this article shall be deemed to constitute financial, legal, tax, or other advice, and no information in this article shall constitute or be deemed to constitute a solicitation or an offer to buy or invest in the financial products mentioned in the article.
Contact
CB Fonder
Strandvägen 5B
SE-114 51 Stockholm
SWEDEN
info@cbfonder.se
+46 (0)8 566 133 10
Responsible for the handling of complaints:
Alexander Jansson