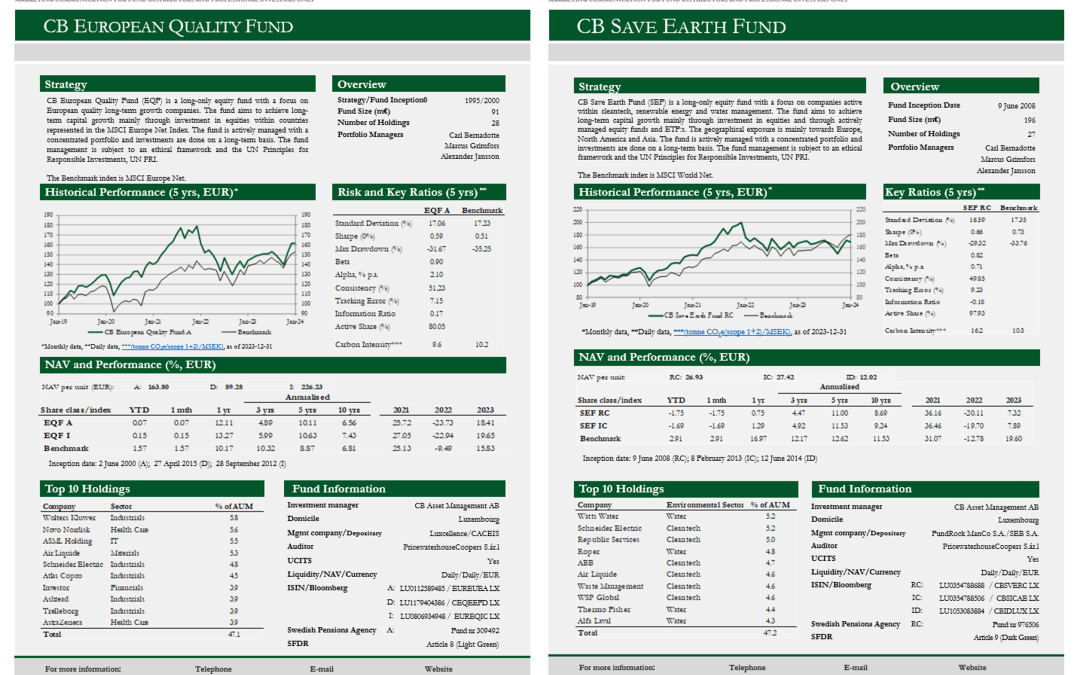
Read the March monthly reports below:
Portfolio Manager’s Commentary
As outlined in our latest newsletter, we initiated a significant shift in the profile of the funds in February. This process continued throughout March and is now nearly complete. During February and March, we reallocated approximately 55% of each portfolio, resulting in the following changes and current compositions.
CB European Quality Fund
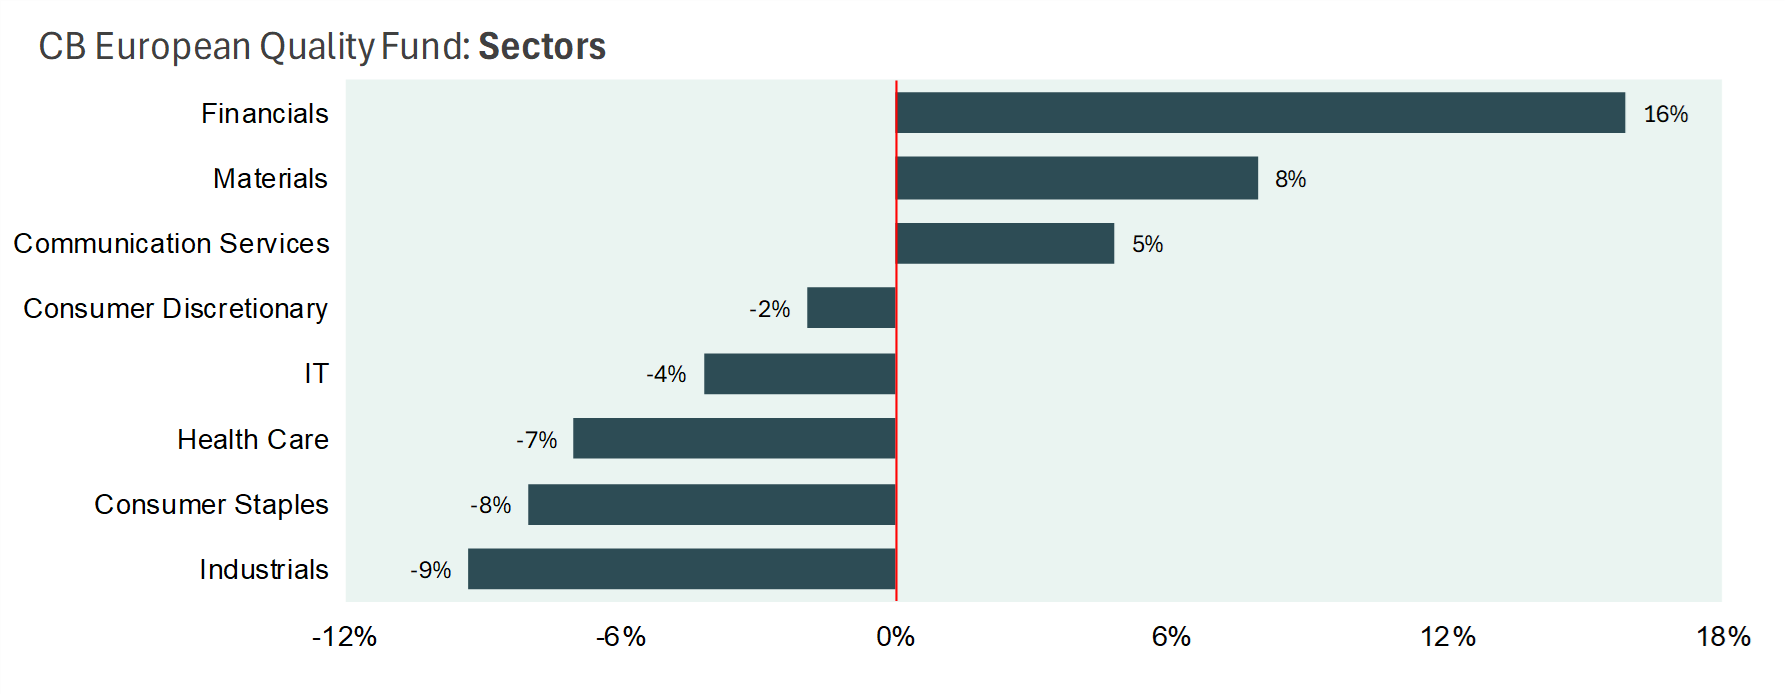
The most notable country allocation changes since the start of the year include a +19% increase in Germany and a -14% decrease in the United Kingdom, which now represent 28% and 8% of the portfolio, respectively. In terms of sector allocation, the most significant changes since the start of the year are a +16% increase in Financials and a -9% decrease in Industrials, which now account for 38% and 33% of the portfolio, respectively.
The fund’s largest exposure is currently to the Financials sector, primarily through insurance companies. This provides high-quality exposure to the financial sector with limited sensitivity to tariffs, while also benefiting from a structurally higher interest rate environment and potential upcoming deregulation. We have also increased our exposure to the Materials sector by +8%, in anticipation of major infrastructure stimulus measures, particularly in Germany.
Changes in country and sector exposure since the turn of the year 2024/2025

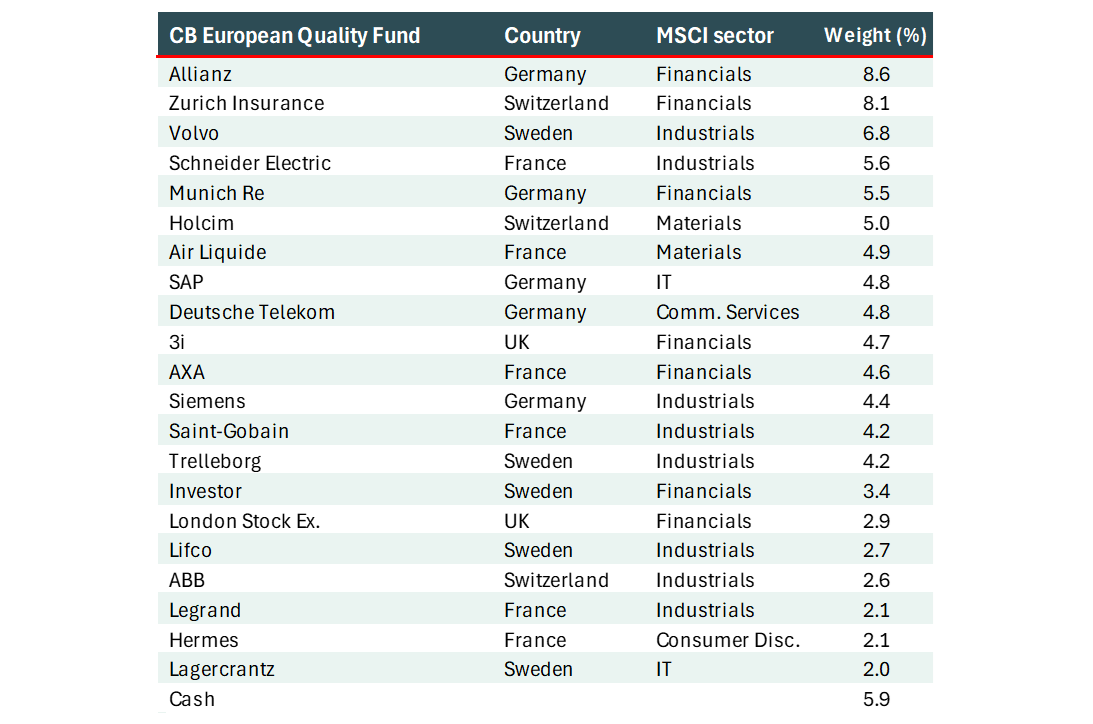
The portfolio as of 31 March
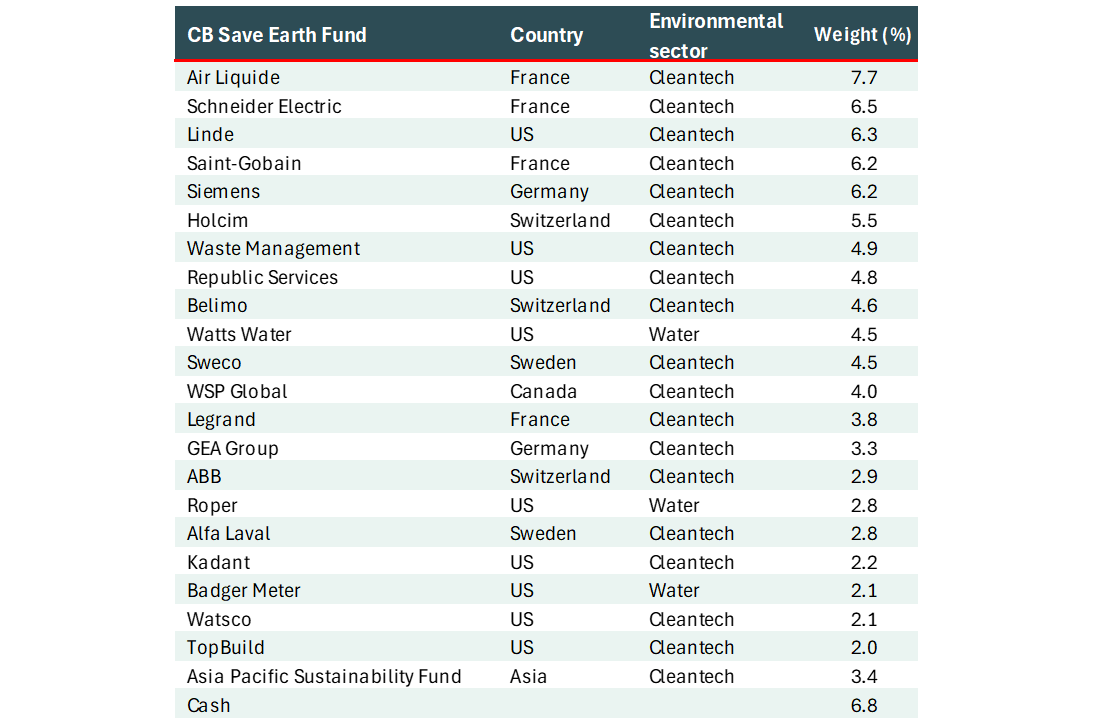
CB Save Earth Fund
The most significant regional shift has been a substantial increase in our exposure to Europe at the expense of the United States. Europe and the U.S. now account for 54% and 32% of the portfolio, respectively. In addition, we have reduced our exposure to Water in favor of cleantech, particularly in Europe. This adjustment reflects our assessment that large-scale infrastructure investments in Europe are likely to generate positive spillover effects for companies operating in the cleantech sector.
Changes in regional and environmental sector exposure since the turn of the year 2024/2025


The portfolio as of 31 March
Europe vs the US and Value vs Growth
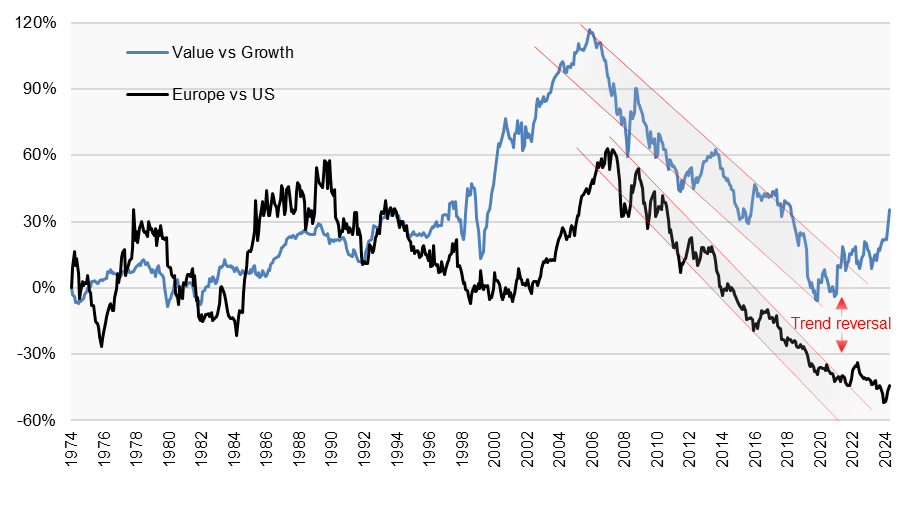
We believe that, for the first time in 17 years (!), we are now witnessing a trend reversal – Europe appears to be starting to outperform the United States. As of the turn of the year, Europe had underperformed the U.S. by -70% since 2007 – an unprecedented gap in both magnitude and duration (with data going back to 1969). Since the beginning of the year, Europe has outperformed the U.S. by +16%, while value stocks have significantly outperformed growth stocks.
Europe vs. the U.S. and Value vs. Growth have historically been closely correlated, at least since the early 2000s. In the chart below, it appears that both of these long-standing trends – which began in 2006/2007 – may now be coming to an end.
