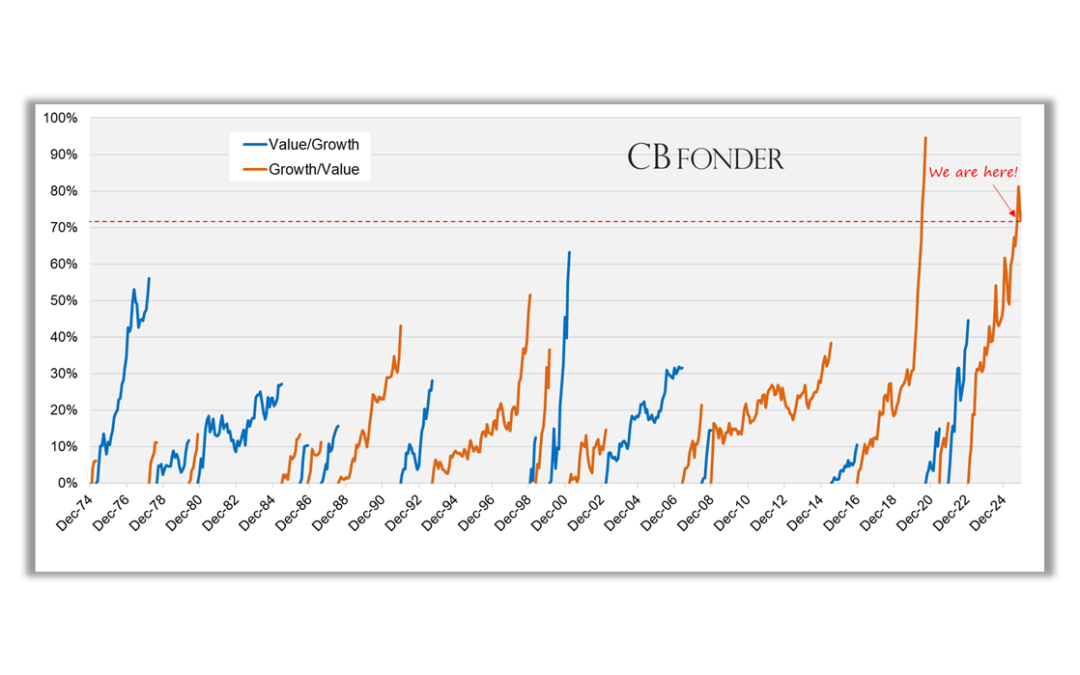
The chart illustrates periods of outperformance for Growth stocks (orange lines), largely driven by the “Mag 7”, versus Value stocks (blue lines) in the US.
As of the end of October this year, Growth stocks in the US had outperformed Value stocks by +81% since the end of January 2023. This represents the second-largest outperformance of Growth relative to Value, with data since 1974. Only the Growth trend between 2016 and 2020 was larger; notably, that period was nearly twice as large as the until then largest Growth trend, which occurred between 1993 and 1999.
A trend is in this context defined as an outperformance of >10%. Monthly data for MSCI USA Growth Net and MSCI USA Value Net, as of 16 December 2025.

Investments always involve risk. Unit prices may rise or fall in value, and investments are always associated with a risk of loss. Past performance is never a guarantee of future returns. This is not investment advice.
Contact
CB Fonder
Strandvägen 5B
SE-114 51 Stockholm
SWEDEN
info@cbfonder.se
+46 (0)8 566 133 10
Responsible for the handling of complaints:
Alexander Jansson