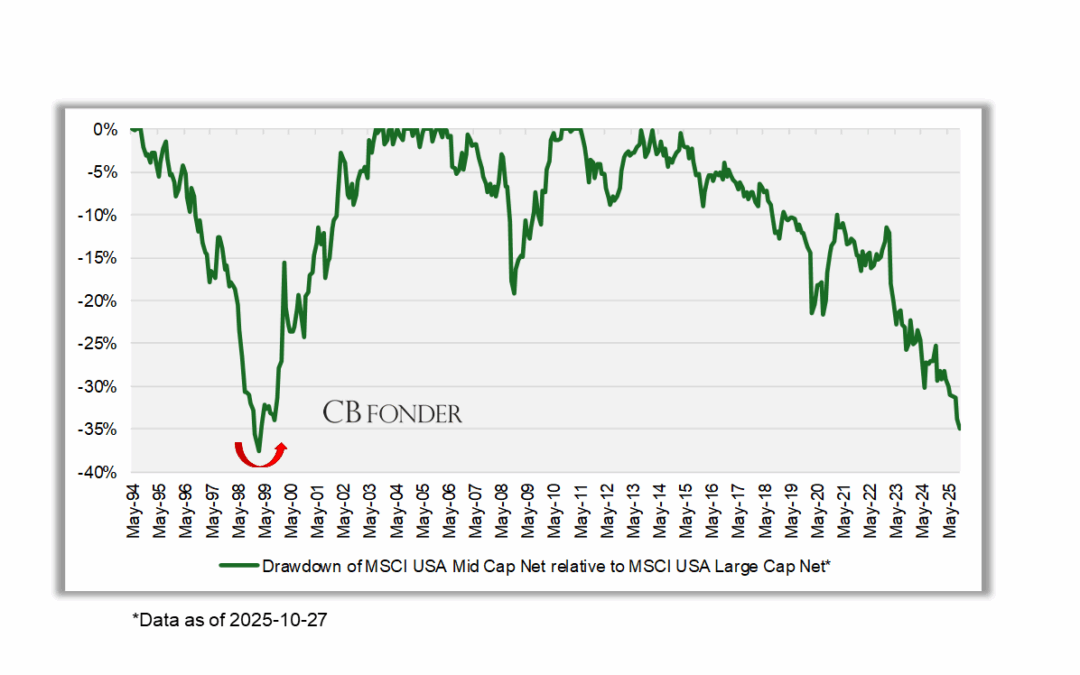
The chart shows the drawdown of MSCI USA Mid Cap Net relative to MSCI USA Large Cap Net (by and large, the Magnificent 7). Never before (with data since 1994) has MSCI USA Mid Cap Net experienced such a prolonged period of underperformance versus MSCI USA Large Cap Net as the current one (approximately 12 years).
The previous period when MSCI USA Mid Cap Net had an underperformance of -35% (January 1999, red arrow in the chart) it was followed by outperformance of MSCI USA Mid Cap Net of around +13% after 1 year, +39% after 3 years, and +60% after 5 years.

Investments always involve risk. Unit prices may rise or fall in value, and investments are always associated with a risk of loss. Past performance is never a guarantee of future returns. This is not investment advice.
Contact
CB Fonder
Strandvägen 5B
SE-114 51 Stockholm
SWEDEN
info@cbfonder.se
+46 (0)8 566 133 10
Responsible for the handling of complaints:
Alexander Jansson