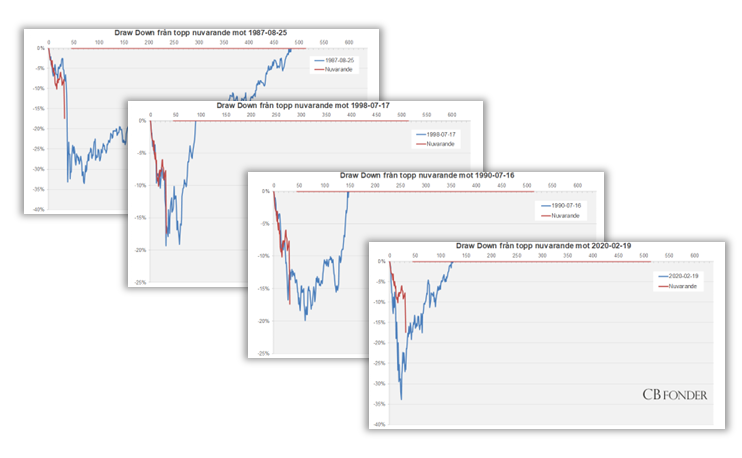
Below are the historical S&P 500 drawdowns in USD that we believe, technically, are the most similar to the current decline, based on data since 1950. The red line in each chart represents the current drawdown, which as of the close on April 4, stands at -17.4%. The x-axis shows the number of trading days since the peak, and the y-axis shows the total percentage drawdown from the peak. Dates indicate the starting point of each respective drawdown.


Contact
CB Fonder
Strandvägen 5B
SE-114 51 Stockholm
SWEDEN
info@cbfonder.se
+46 (0)8 566 133 10
Responsible for the handling of complaints:
Alexander Jansson