The Stocks to Own in the Energy Race: “Violent Demand” Alexander Jansson is interviewed by EFN Ekonomikanalen about the energy race and where he sees buying opportunities. He views the global energy shortage as a buy signal rather than a warning sign, but...
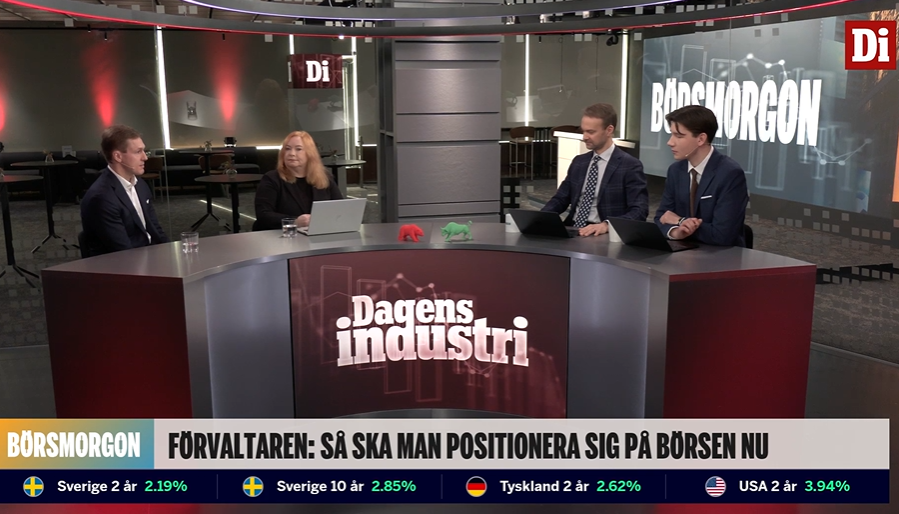
On Thursday morning, 26 March, our portfolio manager, partner and CEO Alexander Jansson once again appeared on DiTV’s Börsmorgon to share his views on the current market environment. The discussion centred on geopolitical uncertainty, structural shifts in the...
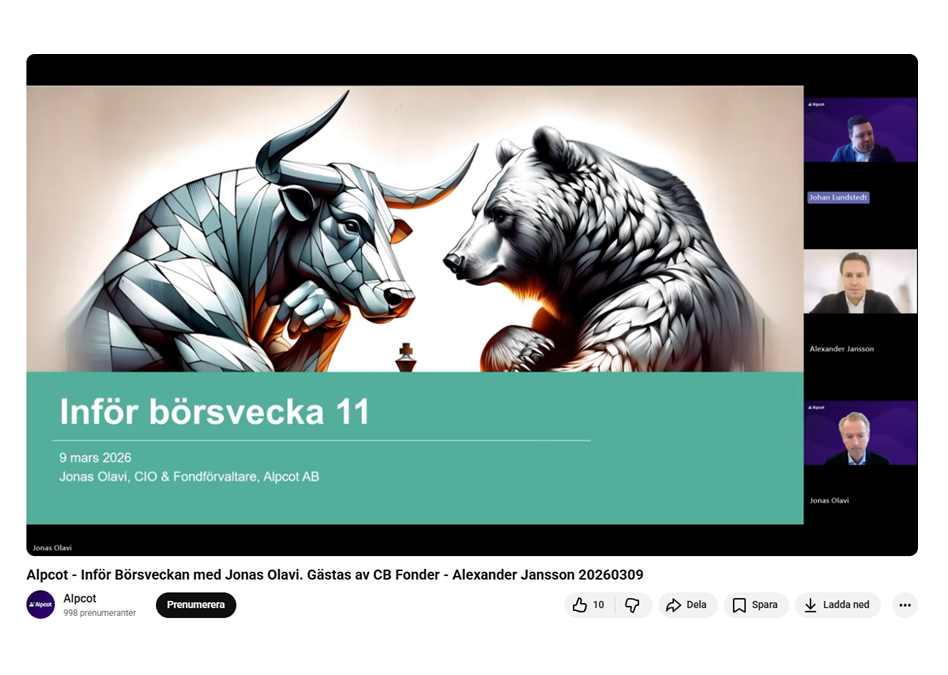
Our CEO, partner, and portfolio manager Alexander Jansson appeared today on Alpcot’s popular YouTube channel in the program Inför Börsveckan (“Ahead of Stock Market Week”). During the episode, he shared our analyses and insights on the European market, and spoke in...
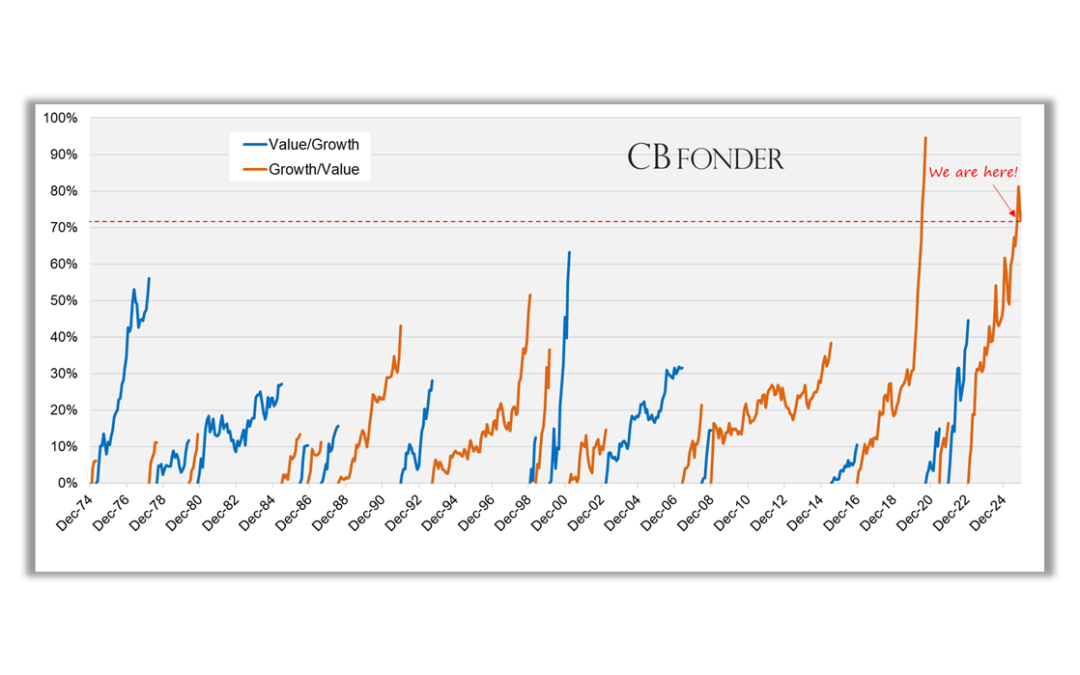
The chart illustrates periods of outperformance for Growth stocks (orange lines), largely driven by the “Mag 7”, versus Value stocks (blue lines) in the US. As of the end of October this year, Growth stocks in the US had outperformed Value stocks by +81%...
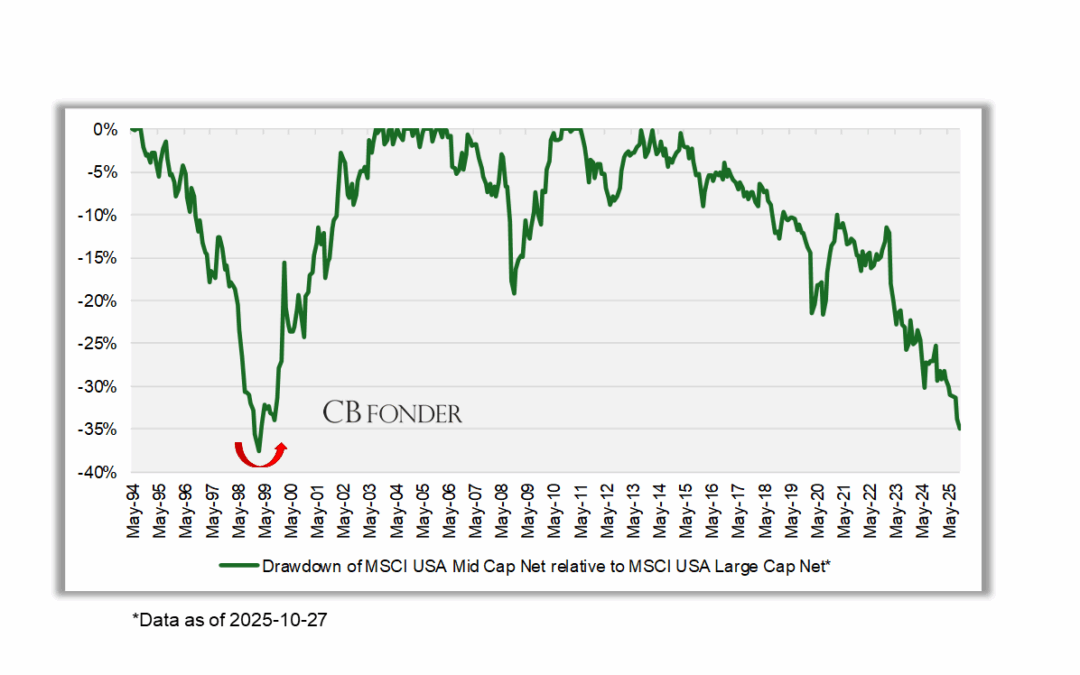
The chart shows the drawdown of MSCI USA Mid Cap Net relative to MSCI USA Large Cap Net (by and large, the Magnificent 7). Never before (with data since 1994) has MSCI USA Mid Cap Net experienced such a prolonged period of underperformance versus MSCI USA Large Cap...